This free tool brings you unique insights into spend and performance of Performance Max campaigns.
The tool
While the Pmax performance has improved across my accounts in the last several months, its reporting capabilities are still poor. I cannot separate video traffic costs from shopping, and can’t see the performance of individual asset group. Until things change, I’ve found a solution. This free Google script will show video, shopping, and “other” traffic costs, as well as individual performance of all asset groups for the last 30 days.
Installation
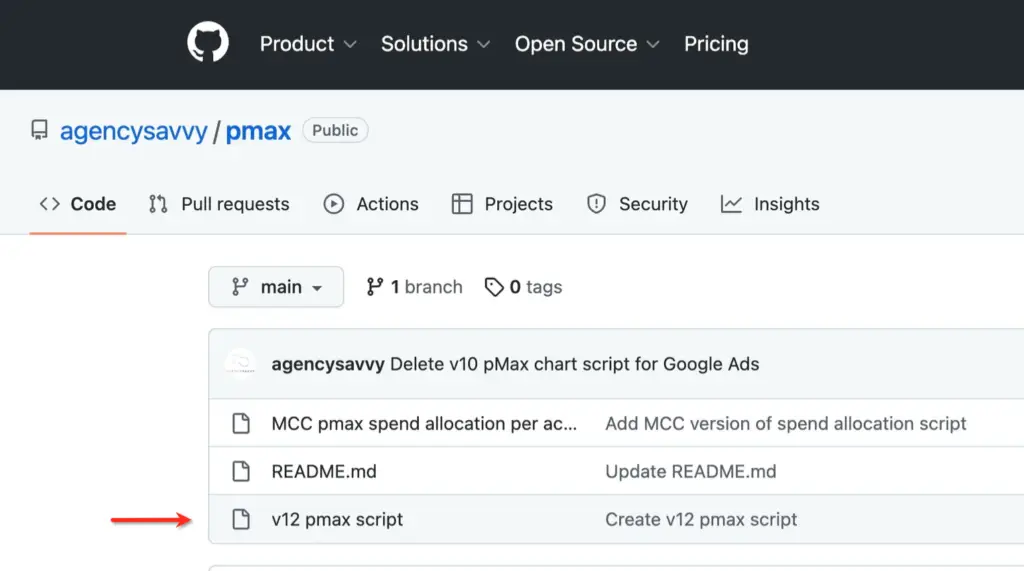
1. On the Agencysavvy GitHub page, click on the script link. At the time of writing, it is called v12 pmax script.
The link to the script on the Agencysavvy Github page
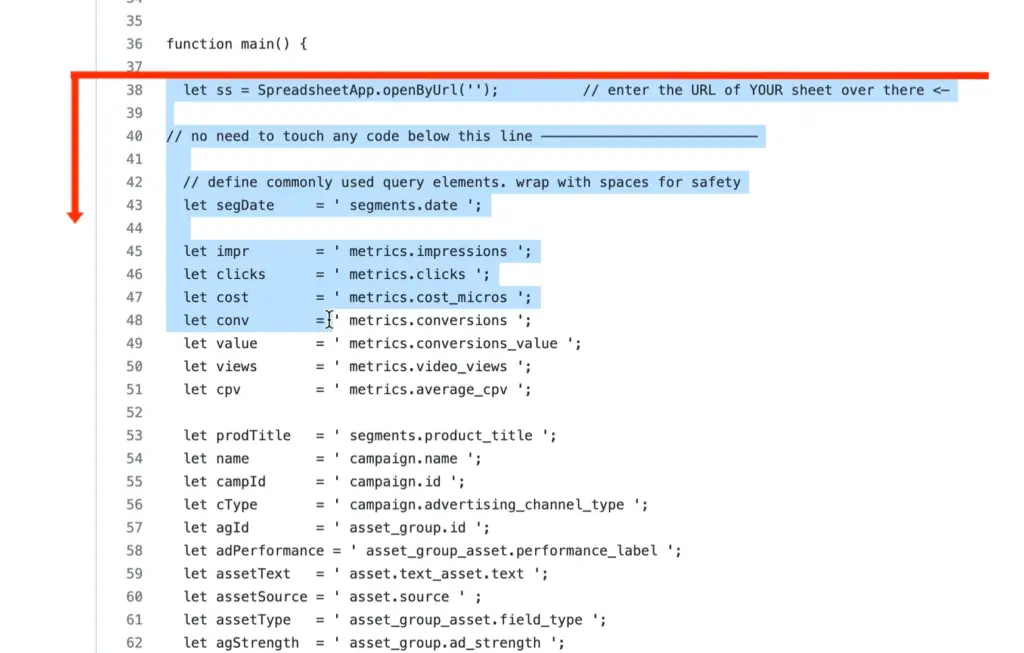
2. Copy the script from line 38 until the end
The script
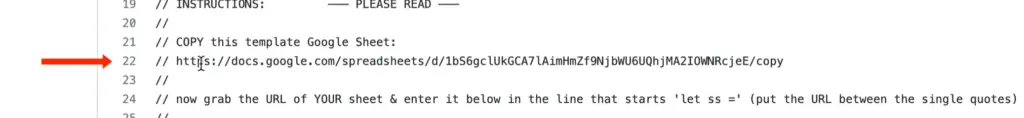
3. Open Google Ads, click on Tools and settings, Scripts, and click on the blue “+” button 4. Enter the name for the script, and paste the code starting from the line 2 down. 5. Return to the original code and copy the link in the line 22. This link will be used to generate the local results spreadsheet
Link to the results spreadsheet template
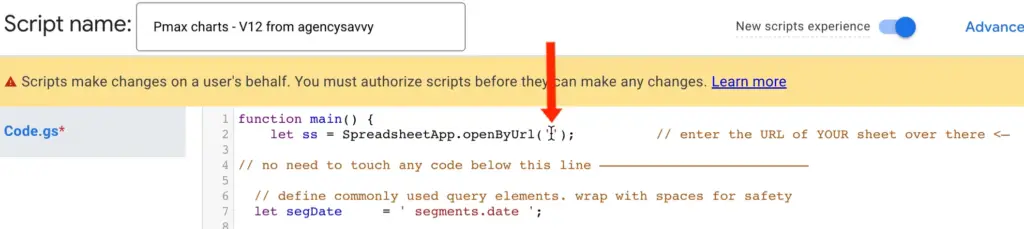
6. Paste this link in a new Chrome browser tab 7. Click Create. The resulting spreadsheet will be collecting reporting data generated by the script. Rename it to something like “My Pmax chart – v12 from Agencysavvy 8. Copy the spreadsheet’s URL 9. Past the URL in the line 2 of your script, between the single quotes
Where to insert the results spreadsheet link
10. Click Authorize when a
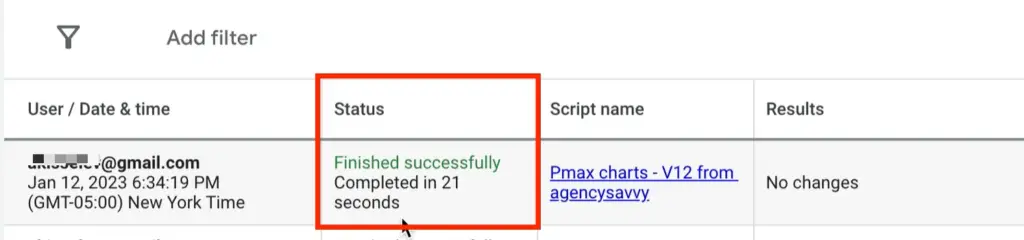
11. Click Preview, make sure the script completes without any status errors
The script status area
12. Select Run, authorize as needed, and make sure the script runs without any status errors 13.Open the spreadsheet; it should have your Pmax data 14. On the Scripts page of Google Ads, set the script running frequency, for example daily between 2 am and 3 am
Viewing the results
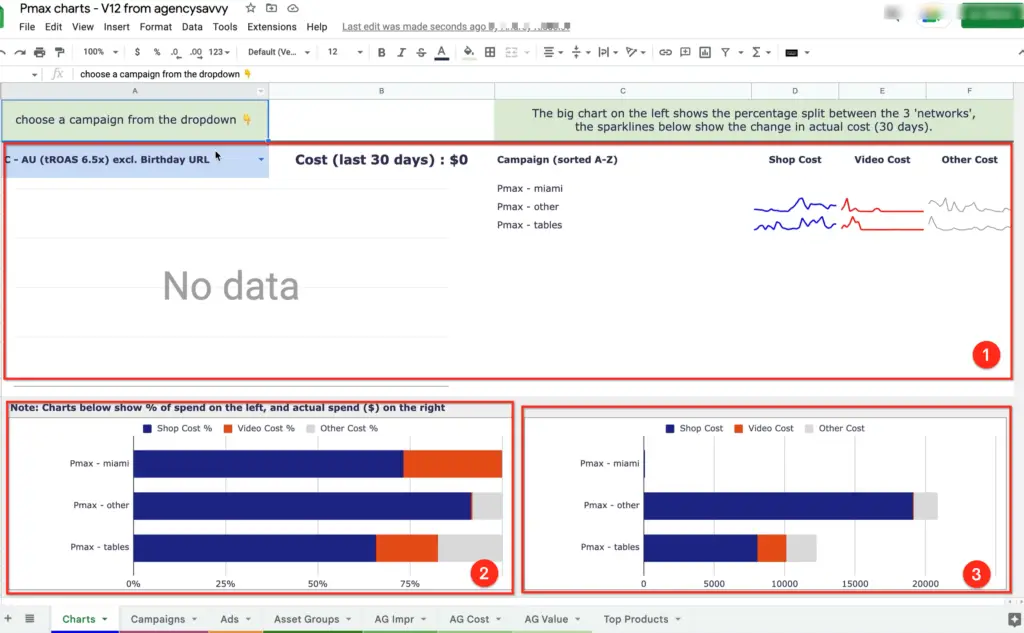
The results are populated in several spreadsheet tabs.
The Charts tab shows traffic costs in the Pmax campaigns.
The graphs in the top part show the dynamics of the shopping, video, and other traffic costs in the last 30 days.
The charts in the bottom part show percentage, and actual spend of various traffic types.
The Charts tab
The Ads tab shows number of assets, and the low quality assets.
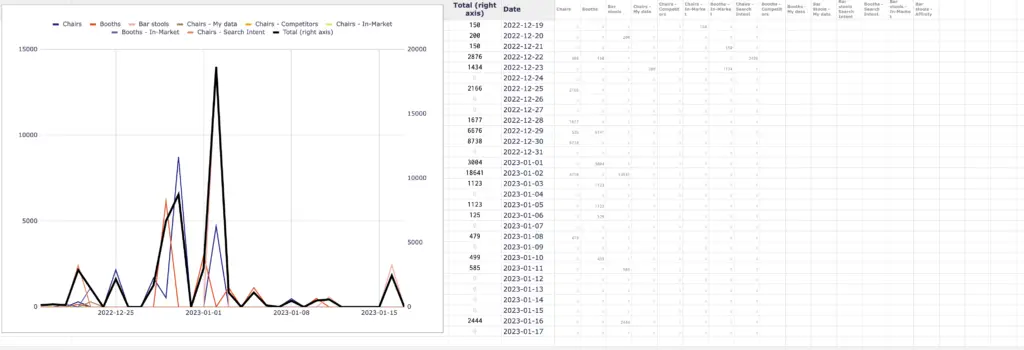
The AG Impr, AG Cost, and AG value tabs thow the detailed KPIs per asset group.
The Asset group value (AG Value) tab
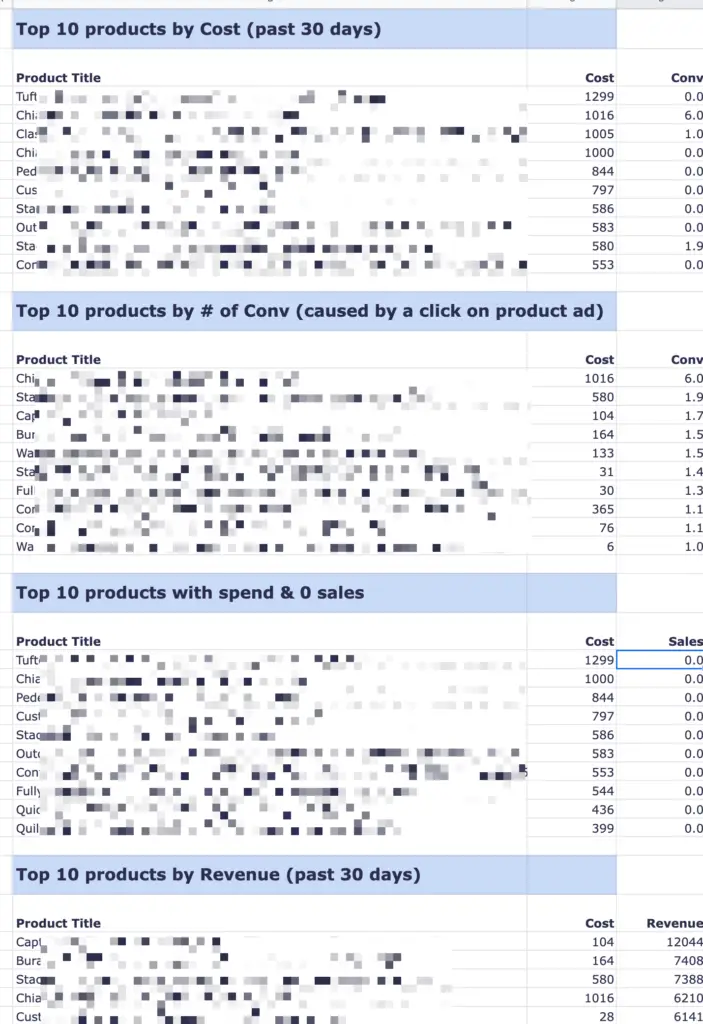
Finally, the Top products tab shows several top 10 product lists for all Pmax campaigns in the account:
Top 10 products by Cost
Top 10 products by # of Conv
Top 10 products with spend & 0 sales
Top 10 products by Revenue
Top Products
Conclusion
This tool brings me valuable, not available elsewhere, Pmax insights, and has become the part of my management process.
Do you find this tool valuable? What other non typical Google Ads tools are you using? Please let me know.
Learn how to exclude inappropriate placements in your Google Ads Performance Max campaigns. Download a list of junk sites and YT channels to simplify the process.